D3.js is a JavaScript data visualization library. D3 uses HTML, CSS and SVG to provide a powerful, flexible library for manipulating the DOM and displaying data. D3 is third-party library, meaning it's easy to incorporate into any kind of web app; simply link to the latest release:
<script src="https://d3js.org/d3.v3.min.js" charset="utf-8"></script>
Recently, while working on an Ember application with a Rails API back end, I wondered how difficult it might be to incorporate D3.js for a data visualization feature. So, I started googling, and came across the Ember Chart library from Addepar. And, with only a small amount of hacking, I was able to get it working.
Since I encountered a few significant "gotchas" while working with the Ember Chart library, I thought I'd write up my implementation, including work-arounds.
Background
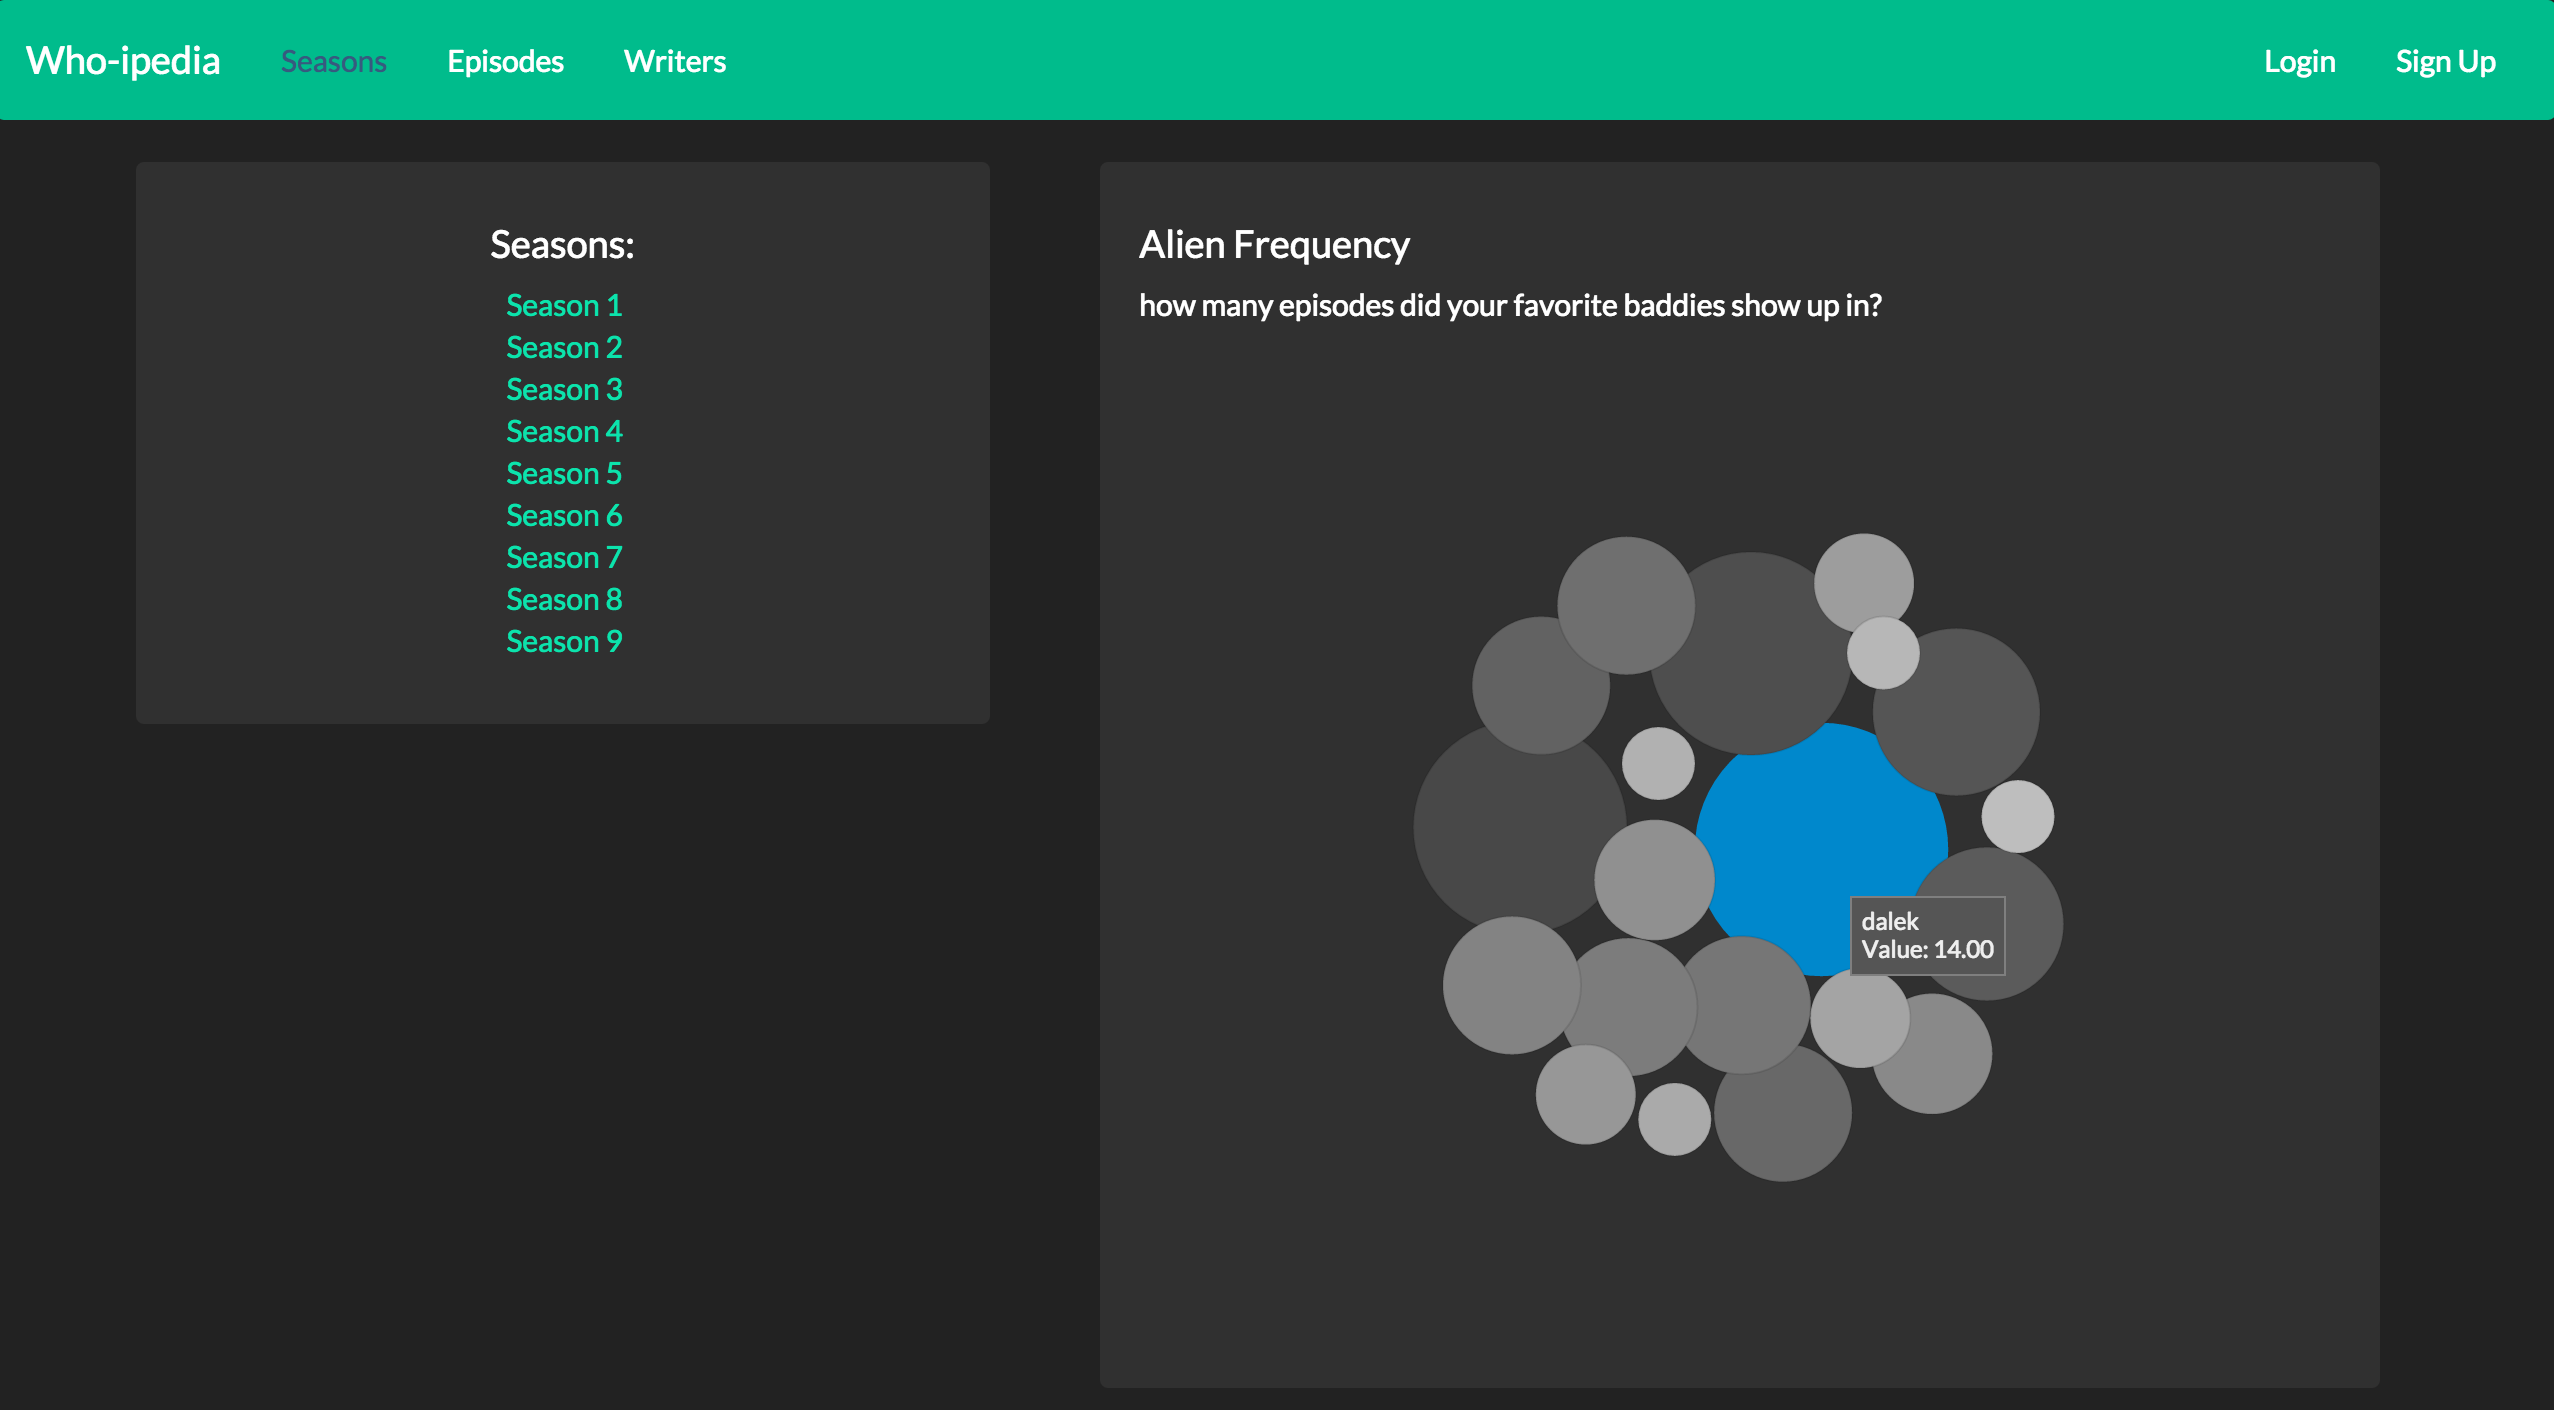
A quick bit of background on the app. Who-ipedia is an encyclopedia of Doctor Who episodes, cataloguing episodes by season and offering episode synopses and info on episode writers.
The app also incorporates D3 to visualize the popularity of recurring aliens by season, (the Daleks are the most prevalent, in case you were wondering).
In this post, we'll take a look at how this feature was built, using Ember Charts.
Incorporating Ember Charts
Let's start by incorporating the Ember Charts library into our Ember app. Then, we'll take a look at how we structure and pass data to the Ember Charts component that will draw our D3 bubble chart.
First, from the command line in the directory of our Ember app:
ember install ember-charts
Now that the Ember Charts library is installed, we have access to the {{bubble-chart}} component, which we can render like this:
<div class="chart-container">
  {{bubble-chart data=bubbleData}}
</div>
We set the component's data property equal to the collection of data we want to visualize with the bubble chart. The bubble chart component expects a data collection that is structured like this:
[
 {:label=>"some item", :value=> <some amount>},
 {:label=>"some item", :value=> <some amount>},
 {:label=>"some item", :value=> <some amount>}
]
Now, let's switch gears and build out an endpoint in the Rails API that serves this Ember app, to deliver the alien popularity data, in the above structure.
Building the API Endpoint
We'll define a route that maps to the #metadata action of the Seasons Controller.
# routes.rb

Rails.application.routes.draw do

  namespace :api do
    namespace :v1 do
      ...
      get "seasons/aliens", to: "seasons#metadata"
    end
  end
end
We'll define that action to return the above-described data structure:
# app/controllers/api/v1/seasons_controller.rb

def metadata
  data = Season.alien_metadata
  render json: data
end
If you're curious, you can check out the Season#alien_metadata method on GitHub. Suffice to say that it tallies up the number of episodes that each alien appears in, and returns the following data structure:
[{:label=>"dalek", :value=>7000},
 {:label=>"cybermen", :value=>4500},
 {:label=>"ood", :value=>3000},
 {:label=>"slitheen", :value=>2000},
 {:label=>"master", :value=>2000},
 {:label=>"missy", :value=>5000},
 {:label=>"krillitanes", :value=>3000},
 {:label=>"sycorax", :value=>2000},
 {:label=>"isolus", :value=>1000},
 {:label=>"abzorbaloff", :value=>500},
 {:label=>"carrionites", :value=>500},
 {:label=>"angel", :value=>2000},
 {:label=>"sontaran", :value=>500},
 {:label=>"hath", :value=>500},
 {:label=>"silence", :value=>3000},
 {:label=>"davros", :value=>1500},
 {:label=>"silurian", :value=>2000},
 {:label=>"auton", :value=>1000},
 {:label=>"kovarian", :value=>1000},
 {:label=>"zygon", :value=>2000}]
I multiplied the number of episodes for each alien by 500, so that the individual circles of the bubble chart would be appropriately sized for the design of the app.
So, a request to the following endpoint: http://localhost:3000/api/v1/seasons/aliens, will return the collection of data above.
Okay, now that our endpoint is all set, let's move back to our Ember app and figure out how to feed this data to our {{bubble-chart}} component.
Sending Data to the Bubble Chart
Recall that we are rending the {{bubble-chart}} component on the season index template:
// app/templates/seasons/index.hbs

{{bubble-chart data=bubbleData}}
So, we need to set that bubbleData property in the Ember app's Seasons Controller.
Using Ajax to GET the Data
First things first, we'll need to make an Ajax request to our Rails API endpoint to get the alien data. To do so, we'll use the Ember Ajax add-on.
In the command line:
ember install ember-ajax
Then, set up the Ajax service:
// app/services/ajax.js

import Ember from 'ember';
import AjaxService from 'ember-ajax/services/ajax';

export default AjaxService.extend({
  host:
   'https://whoipedia-api.herokuapp.com/api/v1'
});
Bonus: Using the Ember Ajax add-on with Ember Simple Auth The season index route happens to be unauthenticated. Meaning, you don't have to be logged in to the app in order to visit the season index page and view the alien bubble chart. However, should you be aiming to make an Ajax request to an authenticated route and, should you be using the Ember Simple Auth library, you can set the necessary request headers in the following manner:
import Ember from 'ember';
import AjaxService from 'ember-ajax/services/ajax';

export default AjaxService.extend({
  session: Ember.inject.service(),
  host:
   'https://whoipediaapi.herokuapp.com/api/v1',
  headers: Ember.computed('session.data.authenticated.token', {
    get() {
      let headers = {};
      const authToken =
     this.get('session.data.authenticated.token');
      if (authToken) {
        headers['auth-token'] = authToken;
      }
      return headers;
    }
  })
});
Setting the Property in the Controller
Now that the Ajax add-on is all set up, let's take a look at our Season Index Controller:
import Ember from 'ember';

export default Ember.Controller.extend({
  ajax: Ember.inject.service(),

  init: function() {
    this._super;
    this.get('ajax')
      .request('seasons/aliens').then((data)=>{
        this.set('bubbleData', data);
    })
  }
});
Note that first, we inject the Ajax service we just defined. Then, we make our Ajax GET request to the seasons/aliens API endpoint. We chain a Promise on to that request that will set the bubbleData property equal to the collection of data returned by that request.
Gotcha Alert
You might we wondering why this request is wrapped inside the init function.
The init function is an Ember Object lifecycle hook that is automatically run after the object (in this case, our controller) is instantiated.
I've wrapped our Ajax call, and our setting of the bubbleData attribute, inside this hook because it was the only way I could find that would gaurantee that the data would be loaded from the API, and the property set, before the template and {{bubble-chart}} component are rendered.
Take note of the call to this._super. Don't forget to always invoke _super when overriding the init function.
Adding Labels to the Bubble Chart
Gotcha Alert
Last but not least, let's get those chart labels working. This was perhaps the biggest "gotcha" I encountered when setting this up. There seems to be a bug in the Ember Charts add-on, and the bubble chart labels were broken for me out of the box.
So, let's fix them. Go to the add-on source code which should be in the node_modules directory in your app.
In node_modules/ember-charts/addon/components/bubble-chart.js, we need to make the following change to the updateVis function, which actually appends the circle elements and defines the mouseover and mouseout functions.
updateVis: function() {
    var vis = this.get('viewport');
    var nodes = this.get('nodeData');
    var showDetails = this.get('showDetails');
    var hideDetails = this.get('hideDetails');
    var fill_color = this.get('getSeriesColor');
    var circles = vis.selectAll("circle")
      .data(nodes, (d) => d.id);
    var that = this;
    circles.enter().append("circle")
      // radius will be set to 0 initially.
      // see transition below
      .attr("r", 0)
      .attr("id", (d) => "bubble_" + d.id)
      .on("mouseover", function(d, i) { return showDetails(d, i, this, that); })
      .on("mouseout", function(d, i) { return hideDetails(d, i, this, that); });

...
The key change is here:
var that = this;
.on("mouseover", function(d, i) {
  return showDetails(d, i, this, that); })
.on("mouseout", function(d, i) {
  return hideDetails(d, i, this, that); });
We must bind this, and pass it into our mouseover and mouseout functions.
Then, we need to make the following changes to those functions:
// --------------------------------------------
// Tooltip Configuration
// --------------------------------------------

showDetails: Ember.computed('isInteractive',
  function() {
    return function(data, i, element, that) {
        // Do hover detail style stuff here
      d3.select(element).classed('hovered', true);
        // Show tooltip
        var formatLabel = that.get('formatLabel');
        // Line 1
        var content = ""
          + data.label + "";
        // Line 2
        content += "" +
          that.get('tooltipValueDisplayName') + ":
            ";
        content += "" +
          formatLabel(Math.floor((data.value /
          500))) + "";
        that.showTooltip(content, d3.event);
    }
  }),

  hideDetails: Ember.computed('isInteractive',
    function() {
      return function(data, i, element, that) {
      // Undo hover style stuff
      d3.select(element).classed('hovered',false);
      // Hide Tooltip
      return that.hideTooltip();
    };
  })
...
That got the labels up and running for me.
Conclusion
This has been a quick walk-through of my implementation of Ember Charts. To recap, we
- Installed the Ember Charts add-on.
- Built a custom API endpoint for retrieving properly formatted bubble chart data.
- Used the Ember Ajax add-on to request the data from that endpoint.
- Made some minor adjustments to the Ember Charts Bubble Chart component in order to fix a bug with the chart labels.
Lastly, don't forget to remove Ember Charts from your .gitignore, or your customization/bug fix won't be pushed up to your server when you deploy your app.